There are times when you need a custom shapes because states or cities just aren’t cutting it, but you don’t have any definitions of the shapes. All you need are the longitude and latitude but how do you get them? I’ve built a tool that lets you draw directly onto a Google map and then generates the correct CSV output to be used as custom polygons in Tableau.
You can find the HTML file here on GitHub, simply download and save to a directory on your computer:
How does it work? When the Google map loads up, find the place you want to draw on and simply click on the point you want to start. A line will appear to draw the next place.
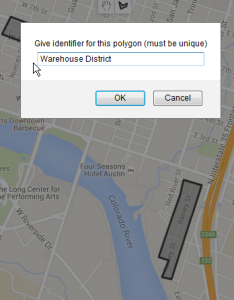
When you touch the line back to the starting point, a box will pop up and ask your what you want to name the polygon. This should be an identifier that matches up with the data you want to blend in later.
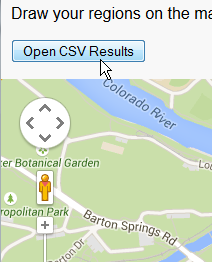
Once you’ve created all the polygons you want, there is an “Open CSV Results” button
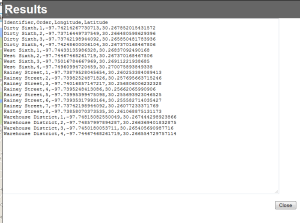
which will pop open a dialog box with the CSV output. Copy this CSV into a text file and save, or paste it directly into Tableau. Now you have the data for your polygons.
You set these up in the exact same way as the CSV output from tool to draw on the background images, only you don’t need to do the background image part, you just use the Latitude and Longitude included in the CSV data. You can see those instructions at the end of this blog post


